Saturday, June 8, 2013

Mysteries in Astrononomy -- Heating of the Sun's Corona

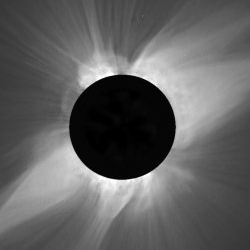
The "atmosphere" of the Sun is a dynamic region of highly charged ions called the corona. The size of the coronal plasma is constantly changing, but it typically extends 1 - 2 solar radii from the surface of the sun. By contrast, the Karman line in Earth's atmosphere (the elevation at which outer space officially begins) is only 0.016 Earth radii from Earth's surface. The corona can only be observed with the naked eye during a solar eclipse, when the majority of light from the sun has been blocked out.


Sources:

The invention of the spectroscope in 1859 allowed 19th century scientists to inquire into the chemical composition of  the corona. After analyzing the spectrum of the corona during the 1879 solar eclipse, astronomers Charles Augustinus Young and William Harkness detected a green emission band of 530 nm that resembled nothing that had ever been observed on Earth. They hypothesized that the emission band was the result of an extraterrestrial element, which they coined "Coronium". Photographing an eclipse with a special solar camera allows the green glow of the corona to be observed (see the NASA picture, Bottom Left). 

It was not until 1941 that the Swedish physicist Bengt Edlén discovered that the 530 nm band was the result of highly charged Iron ions. When Fe (XIII) is excited, it looses an electron (becoming Fe (XIV)) and emits the green light that characterizes the solar corona.

This discovery raised a new question. The oxidation of Fe (XIII) to Fe (XIV) can only occur in temperatures above one million Kelvin. This means that the corona is hundreds of times hotter than the surface of the sun (a measly 5778 K). How is that possible?

A number of theories have been proposed to explain the process of coronal heating. The earliest was the Wave Heating theory, attributed to Evry Schatzman in 1949. It suggests that waves from the interior of the sun carry energy to the corona by propagating through the coronal plasma, just as sound waves propagate through air. These waves are called Alvén waves, and are caused by flowing ions and shifting magnetic fields within the Sun. While computer simulations in the early 21st century revealed that Alvén waves are prevalent enough and can carry enough energy to be the source of coronal heating, no evidence of wave propagation through the corona has been directly observed.

An alternate explanation is Magnetic Reconnection theory. Magnetic reconnection occurs when magnetic fields from large, magnetized regions of the sun's surface induce electrical currents through the coronal plasma. The arcing currents are quickly dissipated  and the energy is converted to heat. It is hypothesized that this is the same process is responsible for solar flares. The following photograph from the Solar Dynamics Observatory illustrates this solar arcing phenomenon. 


It has been heavily debated whether magnetic reconnection is truly the source of coronal heating, because solar arcing events do not seem to occur frequently enough to explain a temperature of over one million Kelvin.

In 2018, NASA will launch Solar Probe Plus. This spacecraft will make several approaches to the sun, the closet one being within 8.5 solar radii of the surface. A carbon-composite heat shield will protect the spacecraft's electronics and scientific instruments, keeping them at roughly room temperature in the face of temperatures up to 2300 K. The spacecraft will measure the dynamics of solar magnetic fields, and attempt to trace the flow of energy within the corona. NASA believes that this mission will finally unearth a solid explanation for the mysterious process of coronal heating.


Source: http://solarprobe.jhuapl.edu/common/content/SolarProbePlusFactSheet.pdf

References:

"Corona." Wikipedia.org. 2013. <http://en.wikipedia.org/wiki/Corona>.

"Mysterious spectral lines in the solar corona led scientists in a hunt for extra-terrestrial elements." Nasa.gov. 2006. <http://sunearthday.nasa.gov/2006/locations/coronium.php>.

"Solar Probe Plus -- A NASA Mission to Touch the Sun." Johns Hopkins University Applied Physics Laboratory. 2010. <http://solarprobe.jhuapl.edu/common/content/SolarProbePlusFactSheet.pdf>.

Varshni, Y.P. and J. Talbot. "CORONIUM." laserstars.org. 2006. <http://laserstars.org/spectra/Coronium.html>.

Wednesday, June 5, 2013

Parallax, Derivation of the Parsec & Lightyear

"Parallax" is the well-known optical phenomenon that causes a stationary object to appear in two different locations when viewed from two different observers. The deviation in the object's apparent position is large when the observers are near the object, and decreases as the observers move farther away. Nearly all vertebrates exploit this phenomenon to visualize 3D space. These animals compare the differences in an object's location between their two eyes to get a sense for how far away it is.

The same principle can be used to determine the distance from Earth to a given star. Imagine a giant salamander in space named Martin. His nose is the sun, and his left and right eyes represent the position of the Earth in the Spring and Fall, respectively.While we humans on Earth only get a 2D view of the sky at any given time, Martin has 3D depth perception of all the stars in the sky due to parallax.

Image sources:
Space: http://stillsound.files.wordpress.com/2012/04/outer-space-stars.jpeg
Salamandar: http://upload.wikimedia.org/wikipedia/commons/1/15/Fire_salamander_March_2008b.jpg
Sun: http://upload.wikimedia.org/wikipedia/commons/b/b4/The_Sun_by_the_Atmospheric_Imaging_Assembly_of_NASA%27s_Solar_Dynamics_Observatory_-_20100819.jpg
Earth:http://upload.wikimedia.org/wikipedia/commons/2/22/Earth_Western_Hemisphere_transparent_background.png

Since the Earth revolves around the sun, the positions of the stars look slightly different throughout the year based on the Earth's current position on its orbit. This phenomenon has been observed by astronomers since ancient times. It allowed the earliest civilizations to determine the length of a year by recording the number of days until a nearby star returned to its same position in the sky, at the same time of the night.

Parallax can be used to determine the distance from the Earth to nearby stars. By measuring the offset angle of a star's position at opposite times of the year using precise telescopes, it is a simple geometry problem to figure out how far away it is.

As an example, let us assume the angle a = 1 arcsecond in the above diagram. The corresponding distance, d, is defined as the parsec -- a fundamental unit in Astronomy. To determine the value of the parsec given our knowledge of the AU, we make the approximation tan(a) = a. Thus, we have
To get a a sense for the length of a parsec, let us compare it to the Lightyear -- the distance light travels in a year:
Thus, a parsec is slightly over 3 lightyears. As large as this seems, it is only 3/4 of the way to the nearest star, Alpha Centauri. This means that in order to use parallax as a meaningful measuring device, telescopes must be able to resolve angles much smaller than 1 arcsecond.


Saturday, April 27, 2013

Radius of the Sun from Doppler Shift

Since the Sun is rotating on its axis, half of its body is rotating towards us while half of it is rotating away from us. This results in a measurable Doppler shift in the emission spectra from the two sides of the sun. Such a spectrum is shown below. The red line is the spectrum from a point on the Sun rotating away from Earth, the black line is from the center of the Sun, and the green line is from a point on the Sun rotating towards Earth. Note the trough at 6224.75 wavenumbers. This indicates the wavelength that is most readily absorbed by the Earth's atmosphere, and has been used to align the three curves.


Our reference wavelength will be the one from the center of the Sun (black line), because the center of the Sun is not rotating and thus this wavelength is not Doppler shifted. Our change in wavelength is approximately the same for the parts of the sun that are moving towards and away from us (as we would expect). We will calculate the values of the reference wavelength and the change in wavelength:


Using the Doppler shift equation, we can solve for the speed at the surface of the Sun:


If we know the angular frequency of the Sun's rotation, we can find the radius. Consider these two images of a particular sunspot (labeled "George") taken 7 days apart. 


We see that the labeled sunspot rotates about a quarter of a turn in this much time. Thus, we can find the angular frequency of the Sun's rotation as follows:


Now, we can solve for radius:


This is the same order of magnitude as the accepted value of 


Transit of Mercury & Distance to Sun

The Transit of Mercury across the Sun allows us to approximate the value of the Astronomical Unit (AU), which is defined as the distance between the Sun and the Earth. As Mercury progressed across the sun, it was photographed periodically by the Transition Region and Coronal Explorer (TRACE) telescope, which was revolving around the earth. An image of the trace is shown below.


Due to the effect of parallax, mercury appears to be following a sinusoidal trajectory. We will use this image to determine the ratio of the amplitude of Mercury's motion to the diameter of the sun. By drawing two chords across the arc portion of the Sun, and finding the intersection of their perpendicular bisectors, we can find the center point of the Sun. Measuring the distance from this center to any point on the arc gives us the radius of the Sun, which we double to get the diameter. Additionally, the amplitude Mercury's motion can be found by drawing two lines through the highest points and the lowest points, and halving the distance between them. These measurements were done using CAD Software, as shown below.


Thus, we can now define the ratio


The geometry of this situation is given by the following diagram.

Using Kepler's third law, we have that

Where Pm and Pe, the periods of the orbits of Mercury and Earth, are 87 days and 365 days respectively. To find Δa we will approximate that α ≈ θ. This is a valid approximation because the radius of the Earth is much smaller than the distance from the Earth to the Sun, and so the lines from the surface of the Sun to the center of the Earth and to the surface of the Earth are ractically parallel. We can find the angle α using the quotient we found from Mercury's transit across the Sun. Since the angle across the diameter of the Sun when viewed from Earth is approximately 0.5°, we have that


Using the small angle approximation, we solve for Δa:


Now, we can solve for the semi-major axis of the Earth:


This is the same order of magnitude of the accepted value,

Friday, April 19, 2013

Measuring Earth's Radius from Angle to Horizon

Here, we will determine how to measure the radius of the Earth by measuring the angle to the horizon. Assume we are at the beach and can see a clear horizon line where the sky meets the water. We will call the radius of the Earth r. We stand a height h above sea level. We measure a distance θ to the horizon. Since the tangent line is perpendicular to the radius of the Earth, we can deduce the following geometry:


We can see that θ is equal to the angle between the two radius vectors. Taking the cosine of this angle, we can deduce the following:


Since the angle down to the horizon will be very small, this 2nd order Taylor approximation for θ is valid. 

Knowing that the true radius of the earth is between 10^6 and 10^7 meters, we can find h as a function of θ.  This will tell us how high we must elevate ourselves, given the minimum angle we are capable of measuring. Solving for h,
Using this equation, we can construct a table for the value of h needed, corresponding to the minimum θ capable of being measured, for r = 10^6 m and for r = 10^7 m:


Assuming that the radius of the earth is 10^7 m (worst case scenario), and that we are capable of measuring 0.5° of angular displacement to the horizon, we see that we must achieve an elevation of 380 m to accurately perform the measurement.